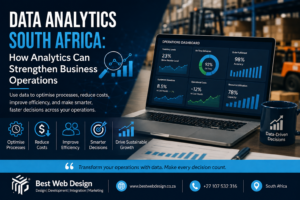

Running a business in South Africa today means managing more moving parts than ever before: inventory across multiple locations, staffing schedules affected by load shedding, supplier delays, customer demand that shifts week to week, and rising operational costs. Most businesses are already collecting data on all of this. Very few are actually using it to run their operations better.
This is where Data Analytics South Africa solutions come in. Rather than treating analytics as a marketing add-on, forward-thinking businesses are applying it directly to the operational side of the business: procurement, logistics, staffing, quality control, and resource allocation. Done properly, this shifts operations from reactive firefighting to a planned, measurable process.
This article looks specifically at how analytics strengthens day-to-day operations, not just marketing dashboards or sales reports. We’ll cover where the biggest operational gains come from, how Data Analytics Johannesburg businesses are applying this locally, practical use cases, common mistakes, and how to get started. For a broader look at analytics and decision-making generally, see our Data Analytics Services in South Africa 2026 Guide.
Table of Contents
- What “Operational Analytics” Actually Means
- Why Operations Need Analytics More Than Ever in 2026
- Traditional Operations vs. Analytics-Driven Operations
- Key Benefits of Data Analytics for Business Operations
- Real-World Use Cases Across Industries
- Best Practices for Applying Analytics to Operations
- Common Mistakes Businesses Make
- Choosing the Right Data Analysis Services Partner
- Frequently Asked Questions
- Related Reading
- Final Thoughts and Next Steps
What “Operational Analytics” Actually Means
Operational analytics is the practice of applying data analysis directly to the processes that keep a business running, rather than only to sales and marketing outcomes. It covers things like:
- Inventory levels and stock turnover
- Supplier performance and delivery reliability
- Staff scheduling against actual demand patterns
- Equipment downtime and maintenance cycles
- Order fulfilment speed and accuracy
- Energy and resource usage
The goal isn’t just to produce a report. It’s to identify where time, money, or capacity is being wasted, and to fix it based on evidence rather than assumption. This is a meaningfully different application of analytics than customer-facing marketing dashboards, even though the underlying tools and data pipelines often overlap with broader online marketing efforts.
Why Operations Need Analytics More Than Ever in 2026
South African businesses are operating under tighter margins and more unpredictable conditions than they were five years ago. Currency volatility, fuel and logistics costs, load shedding schedules, and shifting consumer spending all put pressure on operations teams to do more with less.
At the same time, the tools required to analyse operational data have become far more accessible. Cloud-based dashboards, automated reporting, and AI-assisted forecasting no longer require an enterprise-sized IT department. A mid-sized retailer in Cape Town or a logistics operator in Johannesburg can now access the same class of forecasting tools that were previously limited to large corporates.
This combination, rising operational pressure plus more accessible tools, is why operational analytics has moved from “nice to have” to a genuine competitive differentiator in 2026.
Traditional Operations vs. Analytics-Driven Operations
|
Area |
Traditional Approach |
Analytics-Driven Approach |
|
Inventory management |
Manual stock counts, reorder based on gut feel |
Automated reorder triggers based on demand forecasts |
|
Staff scheduling |
Fixed rosters regardless of demand |
Dynamic scheduling matched to predicted footfall or order volume |
|
Supplier management |
Annual reviews, informal tracking |
Continuous scoring on delivery time, quality, and cost |
|
Problem detection |
Issues noticed after customer complaints |
Anomalies flagged automatically before they escalate |
|
Reporting cycle |
Monthly or quarterly reviews |
Real-time or near real-time dashboards |
|
Decision basis |
Experience and instinct |
Historical data plus predictive modelling |
Neither approach is inherently “wrong,” experience and instinct still matter. But businesses that pair that experience with structured data consistently catch problems earlier and allocate resources more efficiently than those relying on instinct alone.
Key Benefits of Data Analytics for Business Operations
Reduced Operational Costs
Analytics identifies exactly where money is being lost, whether that’s overstocked inventory tying up cash, inefficient delivery routes, or overstaffing during low-demand periods. Even modest improvements in these areas compound significantly over a financial year.
Faster Problem Detection
Instead of discovering a supplier delay or a quality issue after it has already affected customers, analytics tools can flag unusual patterns as they emerge, giving operations teams a window to act before small issues become expensive ones.
Better Resource Allocation
Staffing, stock, and equipment can be aligned to actual demand rather than fixed assumptions. This matters particularly for businesses affected by seasonal demand shifts or unpredictable disruptions like load shedding.
Improved Supplier and Vendor Accountability
Ongoing performance data (on-time delivery rates, defect rates, pricing consistency) gives businesses leverage in supplier negotiations and a clear basis for switching providers when performance drops.
More Accurate Forecasting
Predictive models built on historical operational data help businesses plan procurement, staffing, and cash flow with far more confidence than spreadsheet-based estimates.
Real-World Use Cases Across Industries
Operational analytics applies differently depending on your sector. We work across a range of industries, and the patterns below are the ones we see most often.
Retail
A retailer with multiple branches can use analytics to identify which stores are overstocked on slow-moving lines while others are understocked on fast sellers, allowing stock to be redistributed rather than reordered from scratch.
Logistics and Distribution
Route and delivery data can reveal patterns in delays tied to specific times, regions, or drivers, allowing dispatch teams to adjust planning before customer complaints pile up.
Manufacturing
Equipment sensor data and maintenance logs can be analysed to predict failures before they cause downtime, shifting maintenance from a reactive to a preventive model.
Professional Services
Time-tracking and project data can highlight where scope creep or inefficient workflows are quietly eating into profitability on client engagements.
Finance and Retail Fraud Prevention
Transaction pattern analysis can flag anomalies in real time, reducing losses from fraud or billing errors before they scale.
Best Practices for Applying Analytics to Operations
- Start with one operational bottleneck, not everything at once. Trying to analyse every process simultaneously tends to stall before it delivers results.
- Use data that’s already being collected before investing in new tools. Point-of-sale systems, scheduling software, and CRMs already hold more useful data than most businesses realise.
- Set a clear operational metric before building dashboards. A dashboard without a defined decision it supports is just decoration.
- Review data on a fixed cadence. Weekly or monthly reviews, not just when something goes wrong, catch problems earlier and build the habit of data-led decisions.
- Involve the people who run the process day to day. Operations staff often know which numbers actually reflect reality and which ones are misleading.
Common Mistakes Businesses Make
- Collecting data without a clear purpose. Dashboards full of numbers no one acts on are a common and expensive habit.
- Treating analytics as a one-off project. Operational conditions shift, so models and reports need regular recalibration, not a single setup and forget approach.
- Ignoring data quality issues. Inconsistent or incomplete data produces misleading recommendations, which is often worse than having no analytics at all.
- Over-relying on generic international benchmarks. Load shedding schedules, local logistics realities, and regional consumer behaviour mean South African operations need locally relevant analysis, not templates built for other markets.
- Skipping the human review step. Automated flags and predictions still need a human with operational context to interpret them correctly before action is taken.
Choosing the Right Data Analysis Services Partner
Not every provider brings the same depth of operational understanding. When evaluating a partner, look for:
- Experience applying analytics to operational processes, not just marketing metrics
- The ability to integrate with the systems you already use, such as point-of-sale, scheduling, and inventory software
- Reporting that’s clear enough for operations staff to act on directly, without needing a data science background to interpret it
- Familiarity with South African business conditions, including local logistics, compliance, and infrastructure realities
- A track record of ongoing support, since operational analytics needs regular review, not a single setup
At Best Web Design, this is exactly where our Data Analysis Services are focused: turning day-to-day operational data into practical recommendations businesses can actually act on, rather than dashboards that sit unused. Our approach as a Data Analytics Johannesburg based team is built around understanding how local businesses actually operate, not applying a generic international template. You can see how this fits into our wider work with our clients.
Frequently Asked Questions
What’s the difference between operational analytics and marketing analytics? Marketing analytics focuses on customer acquisition, campaigns, and conversion data. Operational analytics focuses on internal processes such as inventory, staffing, supply chains, and resource use. Many businesses invest in one without realising the other offers equally significant returns.
How much data do we need before analytics becomes useful? Even a few months of consistent operational data (stock levels, staffing hours, delivery times) is usually enough to identify meaningful patterns and starting points for improvement. You don’t need years of historical data to begin.
Can small businesses benefit from operational analytics, or is it only for large companies? Small businesses often see a proportionally larger benefit, since a small reduction in wasted stock or overstaffing has a bigger impact relative to a smaller overall budget.
How long does it take to see measurable results? Basic operational dashboards can be set up within a few weeks. Measurable improvements, such as reduced stockouts or lower overtime costs, typically become visible within one to three months of consistent use.
Do we need to replace our existing systems to start using analytics? No. A good Data Analysis Services provider will connect to the systems you already use, such as your point-of-sale platform, scheduling software, or CRM, rather than requiring a full system replacement.
Is Data Analytics South Africa relevant for businesses outside Johannesburg? Yes. While Johannesburg has a dense concentration of businesses adopting analytics due to its role as an economic hub, the same operational principles apply to businesses in Cape Town, Durban, Pretoria, and smaller regional centres.
Related Reading
- Data Analytics Services in South Africa 2026 Guide
- PPC Agency South Africa: How Paid Ads Deliver Faster ROI Than SEO in 2026
- Core Web Vitals Explained: How Page Speed Affects Rankings and Conversions in South Africa
- The Cookieless Future
Final Thoughts and Next Steps
Operations are where a lot of hidden cost and inefficiency quietly accumulate, and they’re often the last place businesses think to apply analytics. Shifting even one or two core processes, inventory, staffing, or supplier management, from instinct-based to data-informed decision making tends to produce measurable savings within a single quarter.
If you’re ready to see where analytics could strengthen your day-to-day operations, Best Web Design can help you build a practical, locally relevant Data Analytics South Africa strategy rather than a generic dashboard nobody uses. Get in touch to talk through where your operations could benefit most.