
Unplanned downtime now costs Fortune Global 500 manufacturers a combined $1.4 trillion a year, 11% of their total revenue, according to Siemens’ 2024 True Cost of Downtime research. That figure has climbed from 8% of revenue in 2019, and the driver isn’t more equipment failures. It’s more equipment generating more data across more disconnected systems, with fewer people able to see all of it at once.
Most industrial IoT deployments don’t fail because the sensors are wrong. They fail because the data those sensors produce lands in five different systems that never talk to each other: a SCADA system on the plant floor, a separate vibration-monitoring tool, a building management system, a fleet tracker, and a spreadsheet someone updates manually every shift. A centralized IoT dashboard solution is what turns that scattered data into something an operations team can actually act on before a $260,000-per-hour line goes down, not after.
The Growing Complexity of Industrial IoT Environments
A modern industrial facility isn’t running one IoT system. It’s running several that grew up independently. Vibration sensors on rotating equipment, temperature and pressure monitors on process lines, energy meters, RFID asset trackers, and PLC-fed SCADA data all generate continuous streams, often from different vendors with different protocols (Modbus, OPC-UA, MQTT, BACnet) and different data formats.
Two-thirds of manufacturing plants report unplanned downtime at least once a month, and 82% of companies that track outages report events averaging four hours and roughly $2 million per incident. Equipment failure is the single largest cause, but poor visibility into machine health consistently ranks among the top contributing factors, not because the data doesn’t exist, but because it’s scattered across systems no one is watching in real time, all at once.
Add multi-site operations (a manufacturer running six plants across three countries) and the complexity compounds. Each site may have its own historian, its own alert thresholds, and its own maintenance team working from local knowledge that never reaches corporate operations. That fragmentation is exactly what centralized monitoring is built to solve.
Why Decentralized Monitoring Creates Operational Gaps
Point-solution monitoring tools each do their job well in isolation, but a facility running five of them creates gaps no single tool was designed to close:
- Alert fatigue and blind spots. A vibration monitor flags an anomaly, but no one correlates it with the temperature spike on the same asset showing up in a separate system three minutes later. Individually, neither alert looks urgent. Together, they’re a clear failure signature.
- Delayed root-cause analysis. When a line goes down, technicians spend the first thirty to sixty minutes just pulling data from disconnected systems before they can even start diagnosing the actual problem, time that shows up directly in the cost of every incident.
- No single source of truth for leadership. Plant managers reporting up to corporate operations often reconcile numbers from different systems by hand, which means decisions get made on data that’s already hours old.
- Inconsistent maintenance response. Without a shared view, one shift’s technicians may already know about a developing issue that the next shift has no visibility into.
None of these gaps are hardware problems. They’re the direct cost of monitoring infrastructure that was never designed to be viewed as one system.
How Centralized Monitoring Platforms Improve Industrial Operations
Unified Asset Visibility
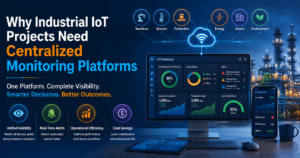
A centralized platform pulls data from every connected system (SCADA, PLCs, standalone sensors, third-party monitoring tools) into a single view, regardless of protocol or vendor. Instead of five browser tabs and a shared spreadsheet, a plant manager sees every asset’s status on one screen, with the same context every other stakeholder is looking at.
Real-Time Alerts and Monitoring
Centralized platforms correlate signals across systems instead of treating each sensor feed in isolation. A vibration anomaly combined with a temperature deviation on the same asset can trigger a single, prioritized alert instead of two disconnected low-priority ones, closing exactly the kind of correlation gap that lets developing failures go unnoticed until they become full stoppages.
Predictive Maintenance
Facilities that pair IoT sensor data with predictive analytics report 40–60% reductions in unplanned downtime and 25–35% reductions in total maintenance costs within the first year, according to industry benchmarking on predictive maintenance implementations. That level of prediction only works when the platform has a complete data picture: a model trained on one isolated sensor feed catches far less than one trained on correlated vibration, temperature, load, and runtime data across the whole asset.
Faster Incident Response
When an issue does occur, a centralized dashboard collapses root-cause analysis from the thirty-to-sixty-minute data-gathering scramble down to a single view technicians can act on immediately. That speed compounds: less time diagnosing means less production time lost, and the industry data on downtime cost makes clear how directly that translates to dollars saved per incident.
Key Features of an Effective IoT Dashboard Solution
- Protocol-agnostic data ingestion: the ability to pull from Modbus, OPC-UA, MQTT, and proprietary vendor APIs without requiring a rip-and-replace of existing sensor infrastructure.
- Configurable, role-based views: a plant technician needs different information than a regional operations director; the platform should serve both from the same underlying data.
- Real-time and historical analysis in one place: live status alongside trend data, so a spike can be evaluated against weeks or months of baseline behavior instantly.
- Threshold-based and anomaly-based alerting: static thresholds catch known failure modes; anomaly detection catches the ones no one thought to set a rule for.
- Edge-to-cloud architecture: local processing for latency-sensitive alerts, with cloud aggregation for cross-site analytics and long-term trend analysis.
- Open APIs and integration support: a dashboard that can’t connect to the existing CMMS or ERP just creates another data silo instead of eliminating one.
- Scalable data retention and export: for compliance reporting, warranty claims, and long-term reliability analysis, not just real-time viewing.
Business Benefits of Centralized IoT Monitoring
- Lower maintenance costs. Strategic sensor networks paired with centralized analysis report 50–70% reductions in maintenance costs while improving asset reliability by 40–55% compared to time-based maintenance schedules.
- Faster ROI on IoT investment. Typical sensor deployments cost $2,000–$8,000 per asset but prevent failures running $50,000–$500,000, and centralized platforms are what turn that raw sensor spend into 12–24 month payback rather than data that never gets acted on.
- Reduced dependence on tribal knowledge. As experienced technicians retire, junior staff can take three to three-and-a-half times longer to diagnose the same failure without a system that surfaces context automatically, a gap in centralized dashboards with historical data and documented failure patterns directly narrow.
- Better capital planning. Consolidated asset health data across a facility, or across multiple facilities, gives leadership a real basis for prioritizing capital replacement instead of relying on whichever plant manager complains loudest.
- Audit and compliance readiness. A single system of record for asset performance and maintenance history simplifies safety, quality, and regulatory reporting considerably compared to reconstructing it from five separate logs after the fact.
Industry Use Cases: Manufacturing, Energy, Logistics, and Utilities
- Manufacturing: Centralized dashboards correlate vibration, temperature, and throughput data across production lines, catching the kind of multi-signal failure patterns that individual point sensors miss, directly addressing the equipment failure category that accounts for the largest share of unplanned downtime.
- Energy: Grid operators and renewable energy operators use centralized platforms to monitor distributed assets (turbines, inverters, substations) spread across wide geographic areas where a technician can’t physically check status without a unified remote view.
- Logistics: Fleet and warehouse operators combine vehicle telematics, cold-chain sensor data, and warehouse automation status in one platform, catching temperature excursions or equipment faults before they turn into spoiled shipments or missed delivery windows.
- Utilities: Water treatment and power distribution operators rely on centralized SCADA-integrated dashboards to monitor infrastructure that’s often decades old alongside newer IoT retrofits, bridging legacy and modern systems in a single operational view.
Selecting the Right IoT Dashboard Solutions for Your Enterprise
- Start with integration compatibility, not features. A dashboard with an impressive feature list is worthless if it can’t ingest data from the SCADA system and sensor fleet already installed.
- Evaluate scalability honestly. A platform that works cleanly for one site needs to be tested against what happens at five sites with different equipment vendors, not assumed to scale automatically.
- Prioritize edge processing for latency-sensitive alerts. Cloud-only architectures introduce delay that matters when the alert is about a bearing about to fail, not a monthly efficiency report.
- Check for open APIs, so the platform can connect to the CMMS, ERP, and any future systems without a vendor lock-in problem down the line.
- Involve the people who’ll actually use it. A dashboard designed without input from plant floor technicians tends to get built around what corporate wants to see, not what a technician needs to act fast.
- Pilot before committing enterprise-wide. A phased rollout on one line or one site surfaces integration issues while they’re still cheap to fix.
Future of Industrial IoT Monitoring with AI and Edge Analytics
The next phase of industrial monitoring is shifting from detection to response. AI-driven anomaly detection models are increasingly reaching F1 scores well beyond 80% in predicting failures before they happen, but industry analysts note that prediction alone is no longer the hard problem: the harder question becoming “do we know what to do when it happens,” as experienced technicians retire and take undocumented failure knowledge with them. Expect centralized platforms to increasingly embed troubleshooting guidance and closed-loop maintenance recommendations directly into the alert itself, not just flag that something’s wrong.
Edge analytics will keep expanding too, processing more inference locally on the device or gateway rather than round-tripping every data point to the cloud, cutting both latency and bandwidth costs while keeping the centralized platform focused on cross-site correlation and long-term trend analysis rather than raw data transport.
Conclusion
Industrial IoT doesn’t fail from a shortage of sensors or data. It fails when that data sits in disconnected systems that nobody can view as a whole in the moment it matters. A centralized IoT dashboard solution turns fragmented monitoring into a single operational picture, correlating signals that point solutions miss and cutting the diagnostic time that turns a minor anomaly into a six-figure stoppage. With downtime costs still climbing and skilled maintenance knowledge walking out the door with retiring technicians, centralized visibility isn’t an optional layer on top of an IoT deployment. It’s the layer that determines whether the rest of the investment pays off.