
Most investors believe they are diversified. They hold twenty tickers, three sectors, and maybe a bond fund. Then a bad week arrives, and everything falls together. That moment teaches a lesson no textbook ever delivers as clearly. Diversification is not about how many positions you own. It is about how differently those positions behave.
Portfolio correlation sits at the center of that idea. Over two decades of building and reviewing portfolios, I have seen the same pattern again and again. Traders chase more names instead of more independence. As a result, they carry hidden concentration without knowing it. The good news is simple. You can lower portfolio correlation and still keep your return engine running. In fact, done well, the two goals support each other.
This guide walks through what portfolio correlation really measures, how to track it, and which practical moves reduce it without dulling performance.
What Portfolio Correlation Actually Measures
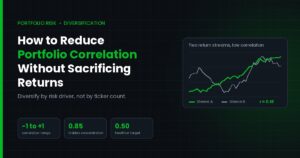
Correlation describes how two return streams move in relation to each other. The number always sits between -1 and +1. A reading of +1 means two assets move in lockstep. A reading of -1 means they move in exact opposite directions. A reading near 0 means their moves are largely unrelated.
Portfolio correlation extends that idea across every holding you own. Instead of comparing two assets, you compare all of them at once. The result tells you whether your portfolio behaves like one big trade or like a collection of independent bets.
Here is the part many people miss. Correlation measures direction, not size. Two assets can both rise, yet one gains 1% while the other gains 12%. Their correlation may still read close to +1. Therefore, correlation tells you about timing and rhythm, not about magnitude. You still need volatility and position size to complete the picture.
Why High Correlation Quietly Damages Performance
A tightly correlated portfolio has one obvious problem and one hidden problem.
The obvious problem shows up in drawdowns. When every position responds to the same driver, losses stack instead of offsetting. A portfolio of ten highly correlated names can fall as hard as a single concentrated position. Meanwhile, the investor assumes the extra tickers provide protection.
The hidden problem is compounding. Deep drawdowns punish long-term growth more than most people expect. A 40% loss requires a 67% gain just to break even. Consequently, smoother equity curves often finish ahead of choppier ones, even when average returns look similar on paper. This is exactly why using correlation in portfolio management improves outcomes rather than limiting them.
Lower correlation also creates a practical benefit. It lets you hold positions through noise. When one sleeve struggles while another performs, you feel less pressure to abandon the plan at the worst possible moment.
How to Measure Portfolio Correlation
Before you can reduce anything, you must measure it. Fortunately, the process is straightforward, and a basic spreadsheet handles most of the work.
Step 1: Collect clean return data
Start with percentage returns rather than raw prices. Daily returns work well for active trading, while weekly or monthly returns suit longer horizons. Above all, keep the periods aligned. Mismatched dates produce misleading results.
Step 2: Choose a sensible lookback window
Short windows react quickly but jump around. Long windows stay stable but respond slowly. Many practitioners track two windows side by side, such as 60 days and 250 days. The gap between them reveals whether relationships are shifting. If the short window sits well above the long one, portfolio correlation is climbing right now.
Step 3: Calculate the correlation coefficient
Spreadsheet software handles this with a single function. Feed in two return columns and read the output. Repeat that step for every pair of holdings in the portfolio.
Step 4: Build a correlation matrix
Arrange each pairwise result into a grid so you can scan the whole book at once. Patterns appear fast. Clusters of high readings mark your true concentration, regardless of how the sectors are labelled.
Step 5: Track average pairwise correlation
Finally, average all the pairwise readings into one number. This single figure summarises portfolio correlation over time. Plot it on a chart, then watch the trend. Rising averages signal that diversification is quietly eroding, even when your holdings list looks unchanged.
Learning how to measure portfolio correlation this way takes an hour to set up. After that, updates take minutes.
The Myth That Diversification Costs Returns
A common objection appears whenever correlation comes up. People assume that adding uncorrelated assets means adding weak assets. That assumption deserves a closer look.
The fear usually comes from one bad habit. Investors reduce correlation by adding low-return holdings such as excess cash or defensive positions they do not believe in. Naturally, returns suffer. However, the problem was never diversification. The problem was the quality of what got added.
Strong diversification works differently. You keep assets with genuine return potential, then arrange them so their return drivers differ. In other words, you change the mix, not the ambition. When each sleeve carries its own edge, lower correlation improves risk-adjusted returns instead of shrinking them.
Seven Practical Ways to Reduce Portfolio Correlation
The following methods come from live portfolio work rather than theory. Each one lowers correlation while keeping the return engine intact.
1. Diversify by driver, not by ticker
Ask what actually moves each position. Interest rates, energy prices, consumer demand, and liquidity conditions all count as drivers. Two stocks in different sectors can still share the same driver. Therefore, group holdings by driver first, then check whether any single driver dominates.
2. Add strategies, not just assets
Correlation in trading falls sharply when strategy logic differs. A trend-following approach and a mean-reversion approach can trade identical instruments yet produce very different return streams. Because their entry rules disagree, their drawdowns rarely align. Strategy variety therefore lowers portfolio correlation without forcing you into unfamiliar markets.
3. Vary your holding periods
Time horizon acts as a diversifier on its own. A swing position and a multi-month position respond to different signals. Consequently, short-term noise that damages one may barely register in the other.
4. Include assets with structurally different behaviour
Commodities, currencies, and rate-sensitive instruments respond to forces that equities often ignore. You do not need large allocations. Even modest sleeves reduce trading portfolio correlation meaningfully.
5. Size positions by correlation-adjusted risk
Equal position sizes create unequal risk. When several holdings move together, treat them as one larger position for sizing purposes. Then reduce each accordingly. This single adjustment often does more than adding new names.
6. Replace rather than accumulate
When you find a promising idea that mirrors something you already own, consider swapping instead of stacking. Portfolios grow correlated because people add without subtracting. Pruning keeps the book sharp.
7. Rebalance on a defined schedule
Winners grow into oversized positions, which pulls correlation upward. Regular rebalancing reverses that drift. Monthly or quarterly reviews usually strike a reasonable balance between discipline and cost.
A Quick Example From Practice
Consider a portfolio built around eight technology names. On the surface, it looks varied. It holds software, semiconductors, hardware, and a payments business. Yet the average pairwise reading sits near 0.85. In practice, that portfolio behaves like one position wearing eight costumes.
Now change three things. Replace two overlapping software names with a single position. Add a rate-sensitive holding and a commodity-linked holding. Then apply a short-term systematic strategy to part of the book instead of holding everything long.
The number of positions barely changes. However, the average portfolio correlation drops toward 0.5. More importantly, expected return does not collapse, because every remaining position still carries a real thesis. Drawdowns shrink, recovery time shortens, and compounding improves.
That example captures the whole principle. You are not removing conviction. You are removing redundancy. Once you see the difference, using correlation in portfolio management stops feeling like a constraint and starts feeling like an edge.
Correlation Changes When Markets Get Stressed
This point deserves special attention because it surprises even experienced investors.
Correlation is not stable. During calm periods, assets follow their own fundamentals, so readings stay moderate. During panic, investors sell whatever they can. Consequently, correlations across markets rush toward +1 exactly when diversification matters most.
Understanding correlation in trading therefore requires context. A comfortable 0.3 reading in quiet markets may become 0.8 during a shock. Sound preparation means testing your portfolio against stressed correlations rather than average ones.
Two habits help here. First, measure correlation separately during down periods. Second, keep at least one sleeve whose behaviour depends on something other than market sentiment. Cash counts. So do genuinely defensive positions held in sensible size.
Common Mistakes Worth Avoiding
Several errors appear repeatedly, and each one is easy to fix.
Relying on labels tops the list. Sector names and fund categories describe marketing, not behaviour. Only the data reveals actual relationships.
Measuring once ranks second. Correlation drifts as markets evolve. A snapshot from last year offers limited value today.
Chasing negative correlation ranks third. Perfectly opposite assets cancel each other out, which removes returns along with risk. Low correlation, not negative correlation, is usually the better target.
Finally, many investors ignore position size entirely. A small uncorrelated sleeve cannot offset a dominant one. Effective correlation management always accounts for weight.
Building a Simple Monitoring Routine
Consistency beats complexity. A short monthly routine keeps trading portfolio correlation under control without consuming your week and treating it like a core business discipline, rather than an occasional check-in, is what makes the habit stick. Moreover, a repeatable process removes guesswork on days when markets feel chaotic.
Begin by updating your return data. Next, refresh the correlation matrix and note the average pairwise reading. Then compare that figure with the previous three months. If it has climbed, identify which pairs drove the change.
After that, review position sizes for any cluster that now moves together. Trim where concentration has grown. Finally, record what you observed in a short note. Over time, those notes build an internal knowledge base for your trading business, revealing how your portfolio behaves across different market regimes — insight no external report can provide.
Bringing It Together
Reducing portfolio correlation is not about diluting your best ideas. It is about making sure those ideas can fail independently. When your holdings depend on different drivers, different strategies, and different time horizons, one bad assumption stops taking down the entire book.
Start with measurement, because clarity comes first. Group your positions by what truly moves them. Add variety in strategy rather than variety in ticker count. Then size everything according to the risk it actually contributes. These steps compound quietly, and the results show up in steadier equity curves rather than dramatic single-day wins. Above all, treat portfolio correlation as a living number that deserves regular attention.
Markets will keep shifting, and correlations will shift with them. Investors who monitor those relationships adapt sooner than those who assume yesterday’s diversification still holds. At GainzAlgo, we believe that clear, data-driven thinking about correlation helps traders build portfolios that last through many market cycles rather than a single favourable one.