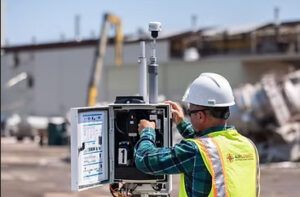

Project work can create airborne dust and volatile organic compounds, also called VOCs. These pollutants can move beyond the active work area and reach nearby properties. Air monitoring equipment rental gives project teams a practical way to measure these changes around a project perimeter. Real-time data can show pollutant levels, wind direction, and changes in air movement. This helps create a clear picture of what may be moving beyond the site boundary.
Start With a Clear Perimeter Plan
Perimeter monitoring works best with a clear plan. Monitoring stations can be placed at key points around the project boundary. The layout can include areas that are upwind, downwind, and crosswind.
A meteorological station can provide wind speed and direction along with temperature and relative humidity. A central system can use this information to help identify the direction of air movement. This makes it easier to understand which monitoring point may receive airborne particles or VOCs.
The station can also provide a continuous record of air movement. This record adds useful context to dust and VOC readings. A change in wind direction can help explain why one perimeter point records a higher level than another.
Measure Dust as It Moves
Dust can contain particles of different sizes. A real-time particulate meter can measure airborne particles by using infrared electromagnetic radiation. The equipment can be set to track PM10, PM2.5, or total suspended particulate levels.
PM10 refers to particles smaller than 10 microns. PM2.5 refers to particles smaller than 2.5 microns. These readings can help show changes in airborne particle levels near the project perimeter.
A rise at one monitoring point may provide useful information about particle movement. Comparing readings from several stations can help show the direction and scale of the change.
This type of measurement can also show short changes in dust levels. A continuous reading may capture a brief increase that a single sample could miss. The data can then be reviewed with wind information to better understand particle movement.
Track VOCs With Compound-Specific Data
VOC monitoring can provide more detail than a single total reading. A field gas chromatograph can measure specific VOC compounds in real time. The system can operate in total volatile organic compound mode or compound-specific mode.
For example, a system can monitor TVOC levels and switch to compound-specific analysis after a set value is reached. This can help identify individual compounds, such as benzene, rather than relying only on a total VOC reading.
This approach can make perimeter data easier to understand. It also gives project teams a better view of changes in VOC concentrations at selected monitoring points.
Compound-specific results can be useful for projects that have a known VOC concern. The data can show which compound is present and how its reading changes across the monitoring area.
Use an Air Quality Monitor for Better Site Data
An air quality monitor can provide direct readings from selected locations. A wider setup may use several stations as part of a complete monitoring plan. Air quality monitoring equipment can combine particulate readings, VOC measurements, and meteorological data.
The value comes from viewing these measurements together. A dust increase may occur at the same time as a change in wind direction. A VOC reading may rise at one point but stay stable at another. Side-by-side data can help explain these differences.
A central computer system can collect readings from the monitoring stations. This creates one record for the selected parameters. Having the information together makes it easier to review changes across the project perimeter.
Real-Time Readings Help Spot Changes Early
Manual sampling gives information from a specific time and place. Real-time monitoring provides a continuous record. This makes it easier to see short changes that a single sample may miss.
Data can also help create a timeline of conditions around the perimeter. Project teams can review readings, compare monitoring points, and identify patterns linked to air movement.
Continuous data can show gradual rises, sudden peaks, and periods of stable readings. These details can give a clearer view of conditions near the project boundary.
Choose Equipment Based on the Project
Every project has different monitoring needs. A site with high dust potential may need stronger particulate coverage. A project with known VOC concerns may need compound-specific analysis.
Rental equipment can also suit short-term projects. The monitoring setup can be selected for the project scope instead of requiring a permanent system.
The monitoring period should match the project activity being observed. Station placement should also reflect nearby properties and likely air movement. A clear plan helps ensure the collected readings answer the main monitoring question.
Final Words:
Perimeter monitoring helps answer a simple question: what is reaching areas beyond the project site? Dust readings, VOC data, and wind information can work together to answer it. For projects that also need monitoring for sulfur dioxide, the monitoring plan should use equipment suited to that specific compound. Good perimeter monitoring is based on the right sensors, suitable station placement, continuous readings, and clear data review. These steps help turn raw measurements into useful information about airborne conditions beyond the project boundary.
For help selecting the right monitoring setup for your project perimeter, contact a qualified air monitoring equipment provider and discuss the site conditions, target pollutants, monitoring points, and project duration.